Financial and ESG Highlights

Consolidated Financial and ESG Indicators for Sompo Holdings

FY2016 FY2017 FY2018
Key Figures(Millions of yen)
 Ordinary Income
 Net Premiums Written (P&C Insurance)
 Life Insurance Premiums
 Ordinary Profit
 Net Income Attributable to Shareholders of the Parent
 Comprehensive Income
 
3,419,530
2,550,336
323,860
241,713
166,402
226,949
 
3,770,052
2,854,755
346,998
141,890
139,817
177,754
 
3,643,040
2,718,155
349,606
198,959
146,626
△ 54,460
Per Share Information (Yen, U.S. dollars)
 Net Income
 Dividends
 (Of which, Interim)
 Diluted Net Income
 
419.15
90.0
40.0
418.71
 
361.39
110.0
55.0
361.09
 
392.26
130.0
65.0
391.96
Financial Condition(Millions of yen)
 Total Net Assets
 Total Assets
 Equity Ratio(%)
 Consolidated Solvency Margin Ratio (%)
 
1,868,940
11,931,135
15.1
748.9
 
1,916,210
11,948,323
15.8
862.5
 
1,779,911
12,018,254
14.6
859.8
Stock Information (Shares)
 Number of Shares Outstanding(Excluding Treasury Stock)
 
393,398,576
 
380,579,944
 
372,426,159
Adjusted Financial Indicators
 Adjusted Consolidated Profit (Billions of yen)
 Adjusted Consolidated ROE (%)
 
1,832
7.6
 
1,627
6.4
 
1,135
4.5
ESG indicators
 Greenhouse Gas Emissions
 (Scope 1–3) (t-CO2)*1
 Ratio of Outside Directors (%)
 Ratio of Female Employees in ManagerialPositions*2(%)
 
 
147,403
30.8
13.2
 
 
156,201
33.3
18.7
 
 
148,486
33.3
20.7

Notes:

  1. Sompo Holdings carried out a reverse split of stocks to combine common stocks at a ratio of four shares to one share on October 1, 2011. Net income per share, dividends per share, and number of shares outstanding (excluding treasury stock) are calculated based on the assumption that the reverse split of stocks was executed at the beginning of fiscal 2010.
  2. Reflecting amendments to the “Accounting Standard for Business Combinations,” etc., since fiscal 2015 the presentation of “net income” has been amended to “net income attributable to shareholders of the parent.”
  3. From the end of fiscal 2011, the consolidated solvency margin ratio as the standard of consolidated financial soundness has been calculated in accordance with the related laws and regulations, including the Ordinance for Enforcement of the Insurance Business Act, revised on March 31, 2011. Above, the figures for fiscal 2012 and before and the figures for fiscal 2013 and after are calculated on a different basis, reflecting the law revision concerning the standards for the calculation of the solvency margin ratio that was enforced at the end of fiscal 2013. Figures are not presented for fiscal 2010.
  4. Diluted net income per share for fiscal 2010 and fiscal 2011 is not shown due to the recording of net loss per share.
  5. Since fiscal 2016, the definition of adjusted consolidated profit has been changed. (Fiscal 2015 figures have been recalculated and presented based on new standards.)
  6. U.S. dollar amounts are translated from yen at the rate of ¥110.99 = U.S.$1.00, the approximate rate prevailing at March 31, 2019.

    1. Figures are the total of Scope 1 (direct emissions due to use of gasoline, etc.), Scope 2 (indirect emissions from electricity and other energy sources), and Scope 3 (indirect emissions across entire value chains, including transport and business trips). Since fiscal 2012, the Group has received an annual Assurance Statement from a third-party certification organization. The coverage of the survey is as follows.
      Fiscal 2012: NKSJ Holdings, Inc. (currently Sompo Holdings, Inc.), and 27 consolidated subsidiaries
      Fiscal 2013: Sompo Japan Insurance Inc., including consolidated subsidiaries, and NIPPONKOA Insurance Co., Ltd., including consolidated subsidiaries
      Fiscal 2014: Sompo Japan Nipponkoa Insurance Inc. and some of its consolidated subsidiaries, including overseas subsidiaries
      Fiscal 2015: Sompo Japan Nipponkoa Holdings and its main consolidated subsidiaries and operating companies
      Fiscal 2016–Fiscal 2018: Sompo Holdings, Inc., and its main consolidated subsidiaries
      Emissions in fiscal 2017 were recalculated based on fiscal 2018 standards.
    2. Data for overseas consolidated subsidiaries as of December 31 in each fiscal year. Data for domestic operating companies as of April 1 in each fiscal year between fiscal 2014 and fiscal 2018; record dates differ before fiscal 2013.

    Adjusted Financial Indicators
    Adjusted consolidated profit is a profit indicator that is meant to more accurately reflect business results and is calculated by adjusting consolidated net income based on JGAAP for catastrophic loss reserve and other items.
    This indicator is used to determine shareholder returns.

Definition of Adjusted Consolidated Profit, Adjusted Consolidated ROE, etc. (Fiscal 2016-Fiscal 2018)

Calculation method
Adjusted profit for each business*5
Domestic P&C insurance*1 Net income
+ Provisions for catastrophic loss reserve (after tax)
+ Provisions for reserve for price fluctuation (after tax)
– Gains/losses on sales of securities and impairment losses on securities (after tax)
– Special factors (e.g., dividend from subsidiaries)
Overseas insurance Net income (including major non-consolidated subsidiaries)
Operating income is used for Sompo International Holdings.*2
Domestic life insurance Net income
+ Provision of contingency reserve (after tax)
+ Provision of reserve for price fluctuation (after tax)
+ Adjustment of underwriting reserve (after tax)
+ Deferral of acquisition cost (after tax)
– Depreciation of acquisition cost (after tax)
Nursing care & healthcare, etc.*3 Net income
Adjusted consolidated profit Total of above adjusted profits
Adjusted consolidated net assets Consolidated net assets (excluding life insurance subsidiary’s net assets)
+ Catastrophic loss reserve in domestic P&C insurance (after tax)
+ Reserve for price fluctuation in domestic P&C insurance (after tax)
+ Domestic life insurance adjusted net assets*4
Adjusted consolidated ROE Adjusted consolidated profit/Adjusted consolidated net assets
Note: The denominator is the average balance at the end/start of each fiscal year.
  1. The total of Sompo Japan Nipponkoa Insurance Inc.; SAISON AUTOMOBILE AND FIRE INSURANCE COMPANY, LIMITED; Sonpo 24 Insurance Company Limited; Sompo Japan Nipponkoa Insurance Services Inc.; Sompo Japan Nipponkoa DC Securities Inc.; and Sompo Risk Management & Health Care Inc. (for fiscal 2017 and after)
  2. The adjusted profit of Sompo International is defined as operating income net of fluctuating, one-time factors (Operating income = Net income − Net foreign exchange gains/losses − Net realized and unrealized gains/losses on sales of securities as well as impairment losses/valuation gains on securities − Net impairment losses recognized in earnings, etc.).
  3. The total of Sompo Care Inc. (the former Sompo Care Message Inc. and Sompo Care Next Inc.); Cedar Co., Ltd.; Sompo Japan Nipponkoa Asset Management Co., Ltd.; Prime Assistance Inc.; Sompo Warranty Inc.; and FRESHHOUSE Co., Ltd.
  4. Domestic life insurance adjusted net assets = Net assets (JGAAP, after tax) + Contingency reserve (after tax) + Reserve for price fluctuation (after tax) + Adjustment of underwriting reserve (after tax) + Non-depreciated acquisition cost (after tax)
  5. Adjusted profit for each business from fiscal 2019 excludes one-time profits/losses and special factors, such as dividends received from subsidiaries.

External Recognition of ESG Initiatives

We have been actively involved in ESG initiatives from an early stage, and our initiatives have been recognized by various institutions globally, as demonstrated by our inclusion in socially responsible investment (SRI) indices. (As of July 1, 2019)

Consolidated Indicators for Sompo Holdings

Expansion in Net Premiums Written

In fiscal 2018, net premiums written declined slightly owing to the sale of Canopius; excluding this factor, they would have increased, mainly reflecting firm sales of products to small and medium-sized enterprises in other lines. Life insurance premiums written also grew strongly due to an increase in the number of policies in force.

Change in the Target Range for the Total Payout Ratio, Basic Policy to Continue Raising Dividends

In fiscal 2019, Sompo Holdings changed its target range to between 50% and100% for the total payout ratio and aims to further improve shareholder returns. The Company plans to increase dividends again for the sixth straight year (including estimates for fiscal 2019), in line with its basic policy of continuing to raise dividend payments.

Medium-Term Improvement Trend in Capital Efficiency

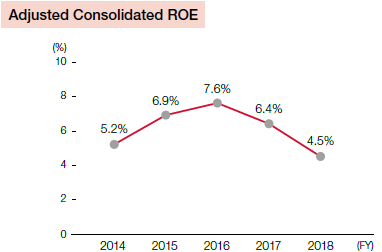
In fiscal 2018, adjusted consolidated ROE declined to 4.5% due to the impact from natural disasters in Japan and elsewhere, but it remained on pace to achieve a record-high level once the impact from natural disasters returns to a normal level. The Company continues to steadily improve capital efficiency.

Increase in the Ratio of Female Employees in Managerial Positions from the Promotion of Diversity

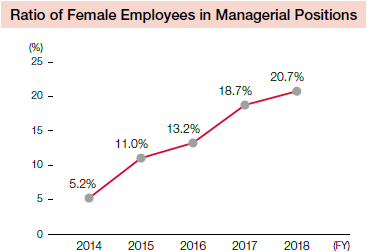
The Sompo Holdings Group has positioned diversity as part of its business strategy and aims to increase the percentage of female employees in managerial positions to 30% by the end of fiscal 2020. We have been proactively promoting female employees to managerial positions.

  • linkedin
  • facebook
  • twitter
  • line