(1) Climate-related strategy
The Sompo Group established SOMPO Climate Action in FY2021, which includes climate change adaptation and mitigation along with contributing to social transformation in our commitment to implementing a comprehensive approach to climate change risks and opportunities. This statement guides our climate-related initiatives.
(1) 1. Climate-related risks and opportunities
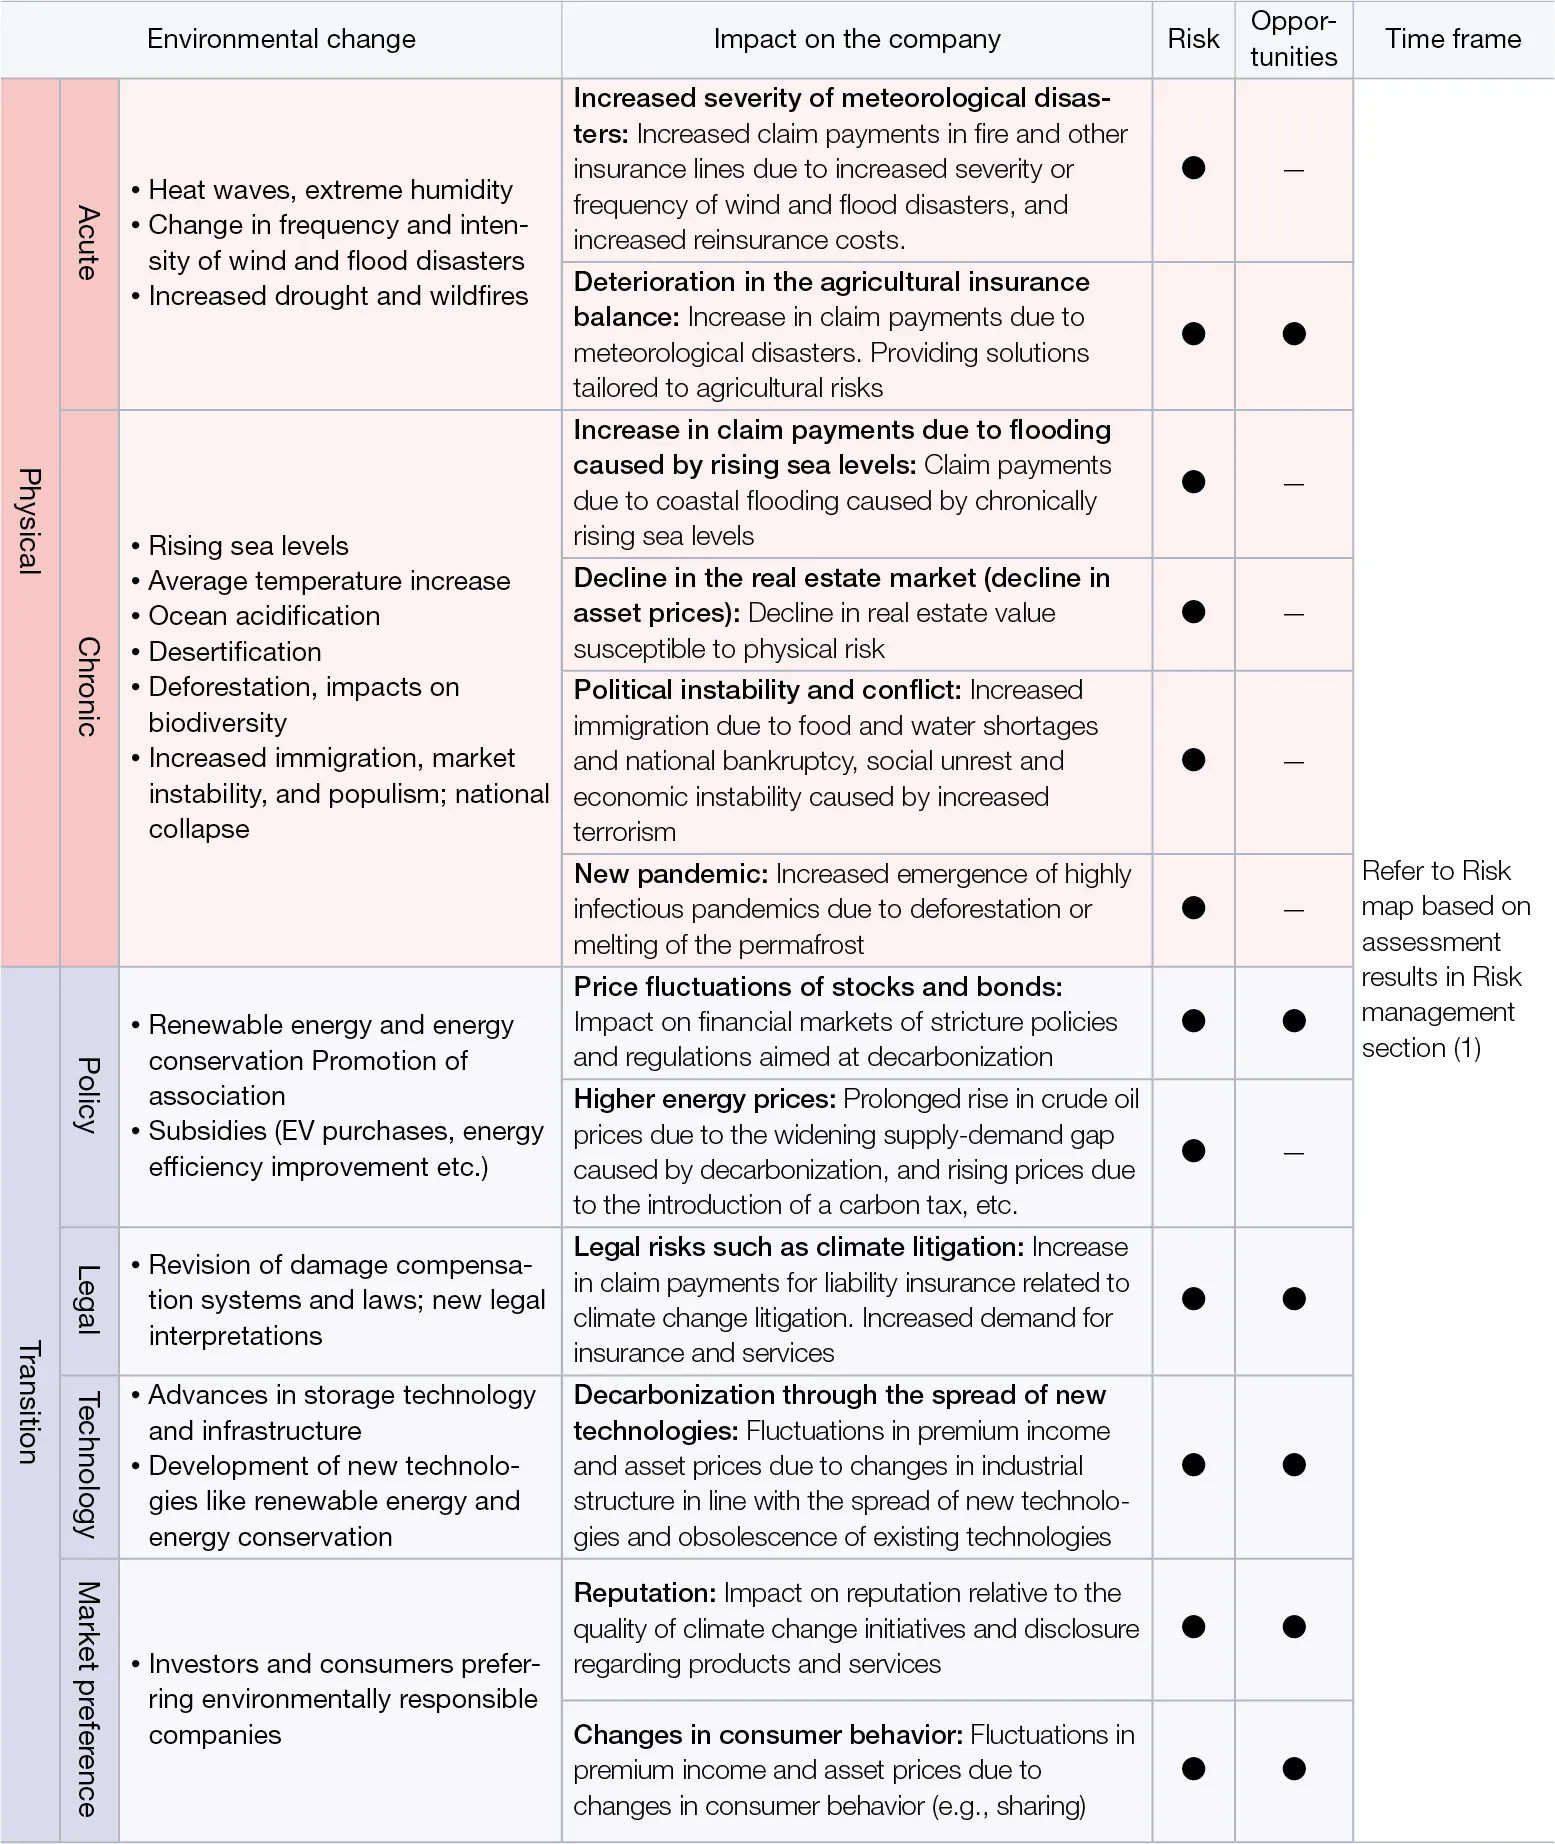
In addition to physical risks such as the increased severity and frequency of natural disasters, droughts, and chronically rising sea levels due to climate change, transition risks may arise as a result of changes in industrial structures and markets brought about by the strengthening of laws and regulations and development of new technologies for the transition to decarbonization that could affect corporate finances and reputations. These risks are accompanied by an increasing number of climate change lawsuits globally that seek to hold companies legally liable for the impact of climate change resulting from their business activities, investment and lending activities in highly carbon-intensive businesses, and improper disclosure. Such lawsuits may increase the risk of liability insurance payouts in the Group’s P&C insurance business. On the other hand, the stronger societal awareness of natural disaster risks and changes in social structure may bring business opportunities such as the creation of new service demands and technological innovations.
We have identified the risks and opportunities coverage of the entire value chain of insurance-related business activities (upstream in product and service development; midstream in sales, marketing, and asset management, downstream in accident response and claim payment) that climate change poses to our business based on the results of studies conducted by external organizations such as the Intergovernmental Panel on Climate Change (IPCC) and the Network for Greening the Financial System (NGFS), and we are assessing, analyzing, and responding to such risks and opportunities on a short- (within 2–3 years), medium- (3–10 years), and long-term (10–30 years) time horizon. The main environmental changes associated with physical and transition risks due to climate change, as well as risks and opportunities that are expected to have a significant impact on the Group, are shown in the following table and are continuously reviewed in light of changes in the internal and external environment.
(1) 2. Scenario analysis
A. Physical risks in underwriting
The Group’s P&C insurance business could be financially affected by higher-than-expected insurance payouts due to the increased severity and frequency of natural disasters, including typhoons, floods, and storm surges. In 2018, we started working with universities and other research institutions to quantitatively grasp risks based on scientific findings. Based on large-scale analysis using weather and climate big data, such as “database for Policy Decision making for Future climate change (d4PDF)*1,” we are working to understand the long-term impacts of a climate with higher average temperatures with respect to changes in the average trends for typhoons, floods, and storm surges affected by sea level changes and trends in the occurrence of extreme weather events. We are also analyzing and evaluating the medium-term impact over the next five to ten years and incorporating this information into our business strategies.
The Group has estimated the impact of typhoons using a quantitative model*2 based on the guidance issued by the UNEP FI TCFD insurance working group in January 2021. The estimated results are below.
| Estimate results |
| Frequency of typhoons |
approx. -30% to +30% |
| Amount of damage per typhoon |
approx. +10% to +50% |
Going forward, we will continue our analysis using the scenario analysis framework being developed by the Network for Greening the Financial System (NGFS), which works on financial regulatory responses to climate change risks.
*1Database of climate simulations developed by Japan's Ministry
of Education, Culture, Sports, Science and Technology's Program for Risk Information on Climate Change. By using a
number of ensemble simulations, future changes in extreme events such as typhoons and heavy rains can be evaluated
stochastically and with greater accuracy. The results enable more reliable assessments of the impact on society of natural catastrophes caused by climate change.
*2Intergovernmental Panel on Climate Change (IPCC): A model that captures changes in the frequency and wind speed of typhoons between now and 2050 based on the RCP8.5 scenario used in the UN’s IPCC Fifth Assessment Report (AR5), and calculates changes in the amount of damage caused.
B. Transition risks and physical risks in asset management
To understand the short-, medium-, and long-term impact of the transition to a decarbonized society on our company, we analyzed the impact on Group assets using the Climate Value-at-Risk (CVaR)*3 provided by MSCI for policy risks arising from tighter laws and regulations and global economic changes that will affect companies in the transition to a decarbonized society, as well as technology opportunities, physical risks to businesses posed by weather disasters caused by climate change, including chronic heatwaves, extreme cold, heavy snowfall, torrential rain, violent storms, acute typhoons, floods, and wildfires arising from climate change mitigation and adaptation initiatives, based on the NGFS scenarios*4 in the following table.
In addition, since it is important to encourage companies that have not yet made progress in decarbonization efforts to reduce transition risks, we use the Implied Temperature Rise (ITR)*5 provided by MSCI to quantitatively analyze whether our portfolio companies have set GHG emission reduction targets consistent with the goal of limiting global warming to 1.5°C by FY2100. For details, refer to “b. Implied Temperature Rise (ITR).”
*3Climate Value-at-Risk (CVaR)
- A method to measure the impact on corporate value associated with climate change-related policy changes and
disasters.
- The future costs and profits arising from climate change-related risks and opportunities are discounted to their
present value, and the impact is calculated as of March 31, 2024, taking into account the market value weighting
of each security in the Group's asset management portfolio.
*4NGFS (Network for Greening the Financial System)
scenarios
Analyzed three climate change scenarios published by the NGFS in November 2023 as Phase 4: Delayed
transition, Net Zero 2050, and NDCs.
| Category |
Scenario |
Summary |
| (1)Disorderly |
Delayed transition |
Assumes annual emissions do not decrease until 2030. Strong policies are needed to
limit warming to below 2°C. Negative emissions are limited. |
| (2)Orderly |
Net Zero 2050 |
Limits global warming to 1.5°C through stringent climate policies and innovation,
reaching global Net Zero CO2 emissions around 2050. Some jurisdictions such as the US, EU, Japan and
etc. reach net zero for all GHGs. |
| (3)Hot House World |
Nationally Determined Contributions (NDCs) |
Assumes that all policies that countries have committed to are implemented. (including all pledged policies, even if not yet implemented, but that are insufficient to stop global warming) |
*5Implied Temperature Rise (ITR)
- One of the forward-looking assessment methods that evaluates the degree of likelihood of 1.5°C and 2°C of global
warming by 2100.
- The contribution to temperature rise is based on the difference between the projected GHG emissions of portfolio
companies (calculated based on current emissions and reduction targets set by the companies) and the carbon
budget, and is calculated as of March 31, 2024, taking into account the market value weight of each stock in the
Group's asset management portfolio.
a. Climate Value-at-Risk (CVaR)
(NGFS scenarios - comparison by asset type)
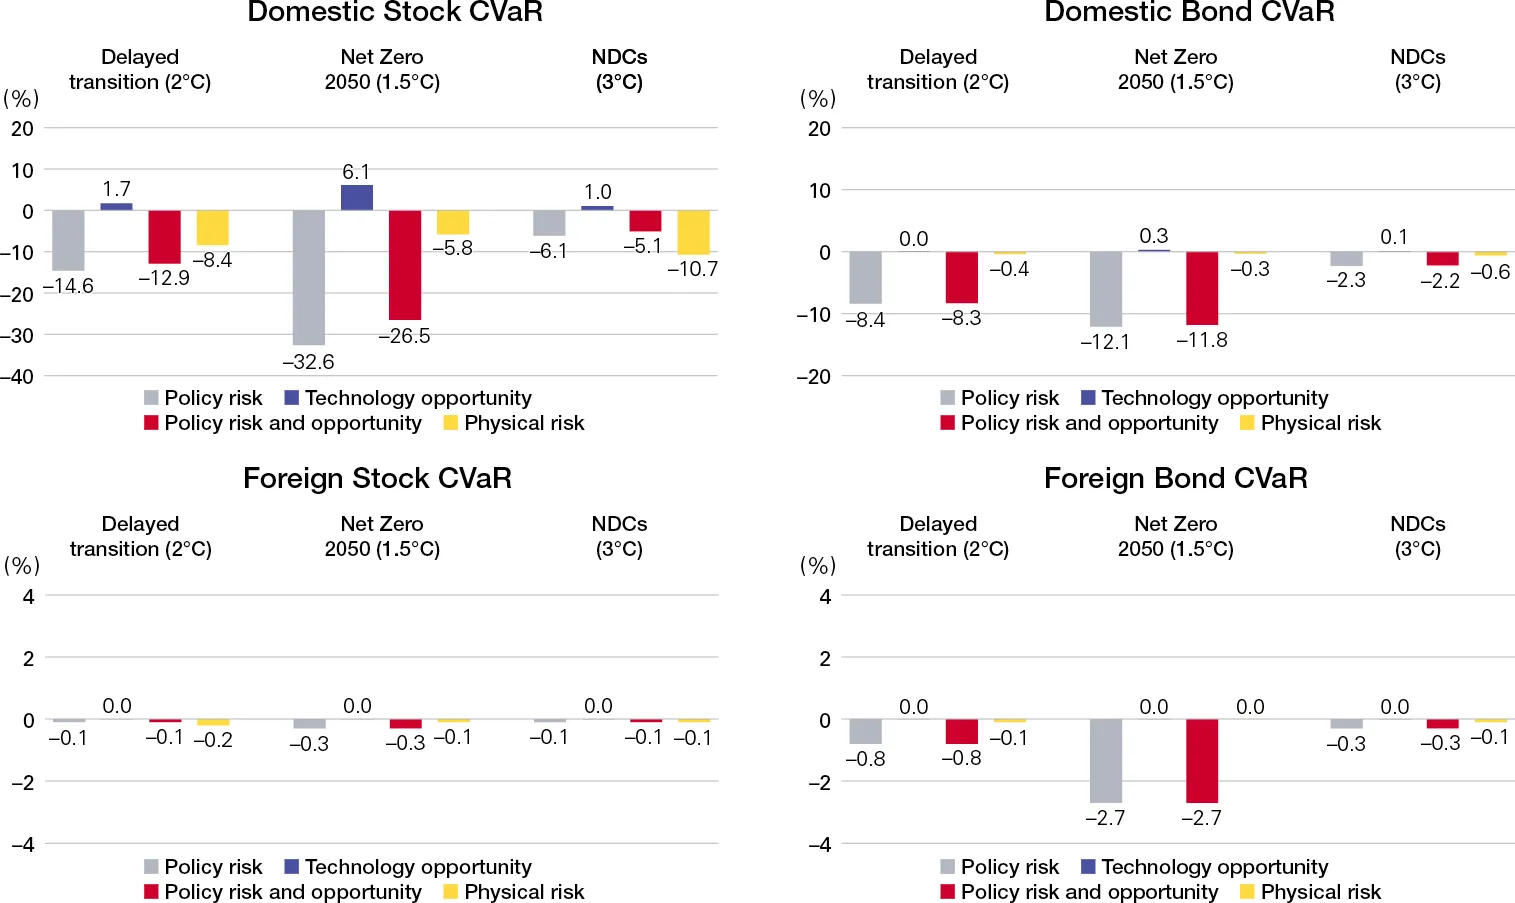
The impact of policy risks and technology opportunity is greatest in the Net Zero 2050 (1.5°C) scenario for all assets, indicating that even with an orderly transition, there are significant policy risks to achieving the 1.5°C target. On the other hand, the impact of physical risk is greatest in the NDCs (3°C) scenario, with the exception of foreign stocks (see bottom left-hand of graph on right), indicating that the physical risk posed by rising temperatures is significant.
In the comparison by asset type, the impact of policy risk and technology opportunity is the largest for domestic stocks (see graph below: top left), at –32.6% and 6.1% under the Net Zero 2050, respectively. Domestic stocks also face the greatest physical risk, declining 10.7% under the NDCs (3°C) scenario. However, we have confirmed that the impact on loans for the Group is limited.
<SOMPO Group CVaR analysis of Policy/physical risks and technology opportunities by asset types and NGFS scenarios>
- Impact is limited because the bonds are never redeemed at more than their face value
- Policy Risk: Figures calculated for each level of Scope 1, 2, and 3 for the cost required to achieve the
GHG reduction targets.
- Technology opportunity: Figures calculated for the potential business opportunities created by
environment-related technologies owned by companies against the backdrop of the transition to a low-carbon
economy.
- Physical risk: Figures calculated based on the impact of chronic or acute extreme weather on corporate assets and sales.
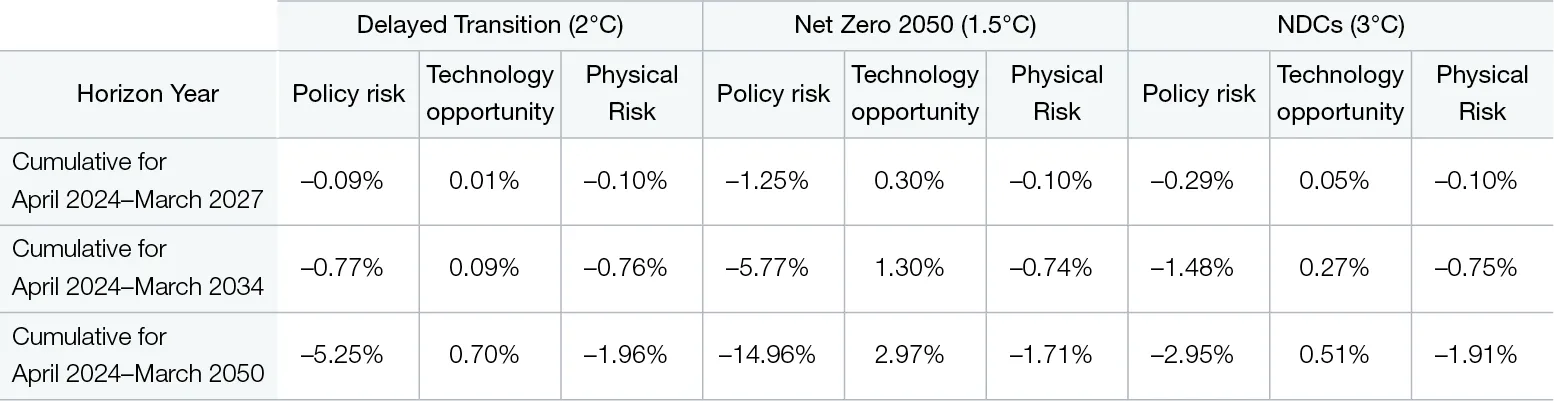
(NGFS scenarios - comparison by short-term, medium-term, and long-term time horizon)
Comparing short-term, medium-term, and long-term time horizons, we can see that the majority of risks in the Group’s portfolio will become apparent after 2034. In particular, the Delayed Transition scenario (2°C; disorderly: rapid transition to decarbonization) assumes a rapid policy transition after 2030, so the long-term impact is particularly pronounced. The policy risk is also highest in the Net Zero 2050 (1.5°C) scenario at -14.96%, which shows that even in an orderly transition to achieving the 1.5°C target, long term policy risks remain large. Physical risk will have relatively greater long-term impact in the Delayed Transition (2°C) scenario and the NDCs (3°C) scenario, which involve rising temperatures, but the overall impact will be limited.
<SOMPO Group CVaR analysis results of Policy/Physical Risks and Technology Opportunities by time horizon>
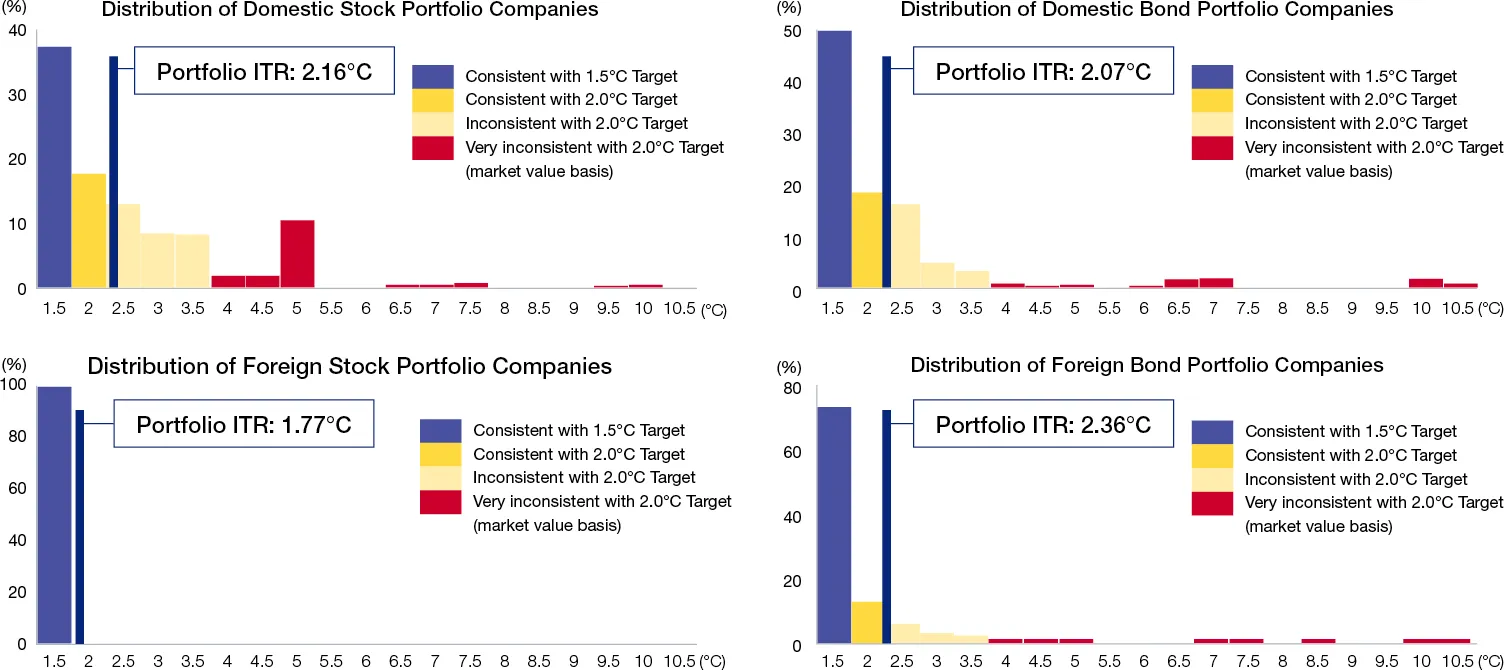
b. Implied Temperature Rise (ITR)
The percentages of companies with ITRs below 2°C for domestic stocks, foreign stocks, domestic corporate bonds, and foreign corporate bond portfolios are 55%, 100%, 68%, and 85%, respectively, on a market value basis. The percentages of companies with ITRs below 1.5°C for domestic stocks, foreign stocks, domestic corporate bonds, and foreign corporate bond portfolios are 37%, 100%, 50%, and 72%, respectively, and with the exception of domestic stocks, more than half of companies have set GHG emission reduction targets that are consistent with the 1.5°C target set by the Paris Agreement. On the other hand, for the portfolio as a whole, the ITRs for domestic stocks, foreign stocks, domestic bonds, and foreign bonds are 2.16°C, 1.77°C, 2.07°C, and 2.36°C, respectively, exceeding 1.5°C for all categories despite some improvements.
< SOMPO Group ITR analysis by asset types >
Source: Sompo Holdings, using MSCI’s Climate Value-at-Risk and Implied Temperature Rise metrics
Disclaimer:This report contains information sourced from MSCI Inc., its affiliates, or information providers (the “MSCI Parties”) and may have been used to calculate scores, ratings, or other indicators. The information is for internal use only, and may not be reproduced or resold in any form, or used as a basis for or a component of any financial instruments or products or indices. The MSCI Parties do not warrant or guarantee the originality, accuracy, and/or completeness of any data or information herein and expressly disclaim all express or implied warranties, including those of merchantability and fitness for a particular purpose. None of the MSCI Parties shall have any liability for any errors or omissions in connection with any data or Information herein, or any liability for any direct, indirect, special, punitive, consequential or any other damages (including lost profits) even if notified of the possibility of such damages.
(1) 3. Resilience improvement initiatives
A. Responding to risks
<Physical Risk>
Our P&C insurance and reinsurance contracts are primarily short-term contracts, and by reviewing our insurance underwriting conditions and reinsurance policies in light of the increasingly severe trends in meteorological disasters, we can reduce the risk of claim payments exceeding our expectations. We also aim to ensure resilience against physical risks through a multifaceted approach that includes global geographic diversification, quantification based on short- and medium-term climate forecasts, and identification and evaluation of significant risks through long-term scenario analysis.
<Transition Risk>
As for our own GHG emissions, we have set a target of a 60% reduction (compared to 2017)*1 in Scope 1, 2, and 3 (excluding insurance underwriting, investments and loans) by 2030 and a net zero emissions by 2050. To achieve this goal, we have set a target of 70% introduction of renewable energy by 2030, *2 in addition to working to conserve energy by switching to LED lightings and taking other steps to reduce electricity consumption, which accounts for a particularly large proportion of GHG emissions. We are working on the roadmap to achieve this goal, including switching to renewable energy sources for power generation in our buildings.
- Science-based targets consistent with the Paris Agreement's 1.5℃ target (a reduction of at least 4.2% each year)
- Including use based on renewable energy certificates
With regard to investments and loans, in addition to the interim target of reducing GHG emissions (Scope 3 Category 15) of the investment portfolio to net zero by 25% in 2025 (compared to 2019), a new interim target of “reducing intensity in the 50-60% range in 2030 (compared to 2019)” was set in fiscal
2024. To achieve this target, we have been focusing on engaging with the top 20 high GHG emitters among our equity holdings and shifting to low GHG emitting sectors when replacing the assets under management held by the Group.
B. Responding to opportunities
In addition to developing and providing climate risk consulting services and working to improve natural disaster
resilience through insurance products and services, the Sompo Group is developing and providing insurance products
and services that contribute to carbon neutrality by promoting renewable energy and collaborating with business
partners.
In FY2024, we set a Transition Insurance Target for insurance products that contribute to decarbonization in both domestic and overseas markets. We also calculated We also calculated GHG emissions associated with insurance underwriting (Insurance-Associated Emissions) using data from companies that disclose GHG emissions (Scope 1, 2) by utilizing a method for measuring GHG emissions in the commercial insurance sector developed by Partnership for Carbon Accounting Financials (PCAF) in November 2022.
In accordance with the principles of the Japan’s Stewardship Code, Sompo Japan Insurance conducts an ESG survey (Survey on ESG/Sustainability Initiatives) every year to confirm the policies and status of the companies in which it holds stocks regarding the enhancement of their corporate value and sustainable growth. In FY2024, it sent the survey to 1,329 companies in which it holds stocks, and 226 companies responded. The survey is used to understand the needs of each company and create opportunities for collaboration, supporting sustainability efforts, including decarbonization, in addition to being used in exercising voting rights.
Various organizations and groups around the world are actively discussing the formulation of regulations and guidance to realize a net-zero carbon society. By proactively participating in and leading these rule-making efforts, the Group will not only contribute to societal transformation but also seek to create and expand business opportunities for the Group, such as attracting collaboration partners both by accumulating knowledge and by enhancing our reputation through these efforts.